 A Year of Adjustment in Austin's Housing MarketThe year 2023 marked a significant shift in the Austin real estate market. According to the comprehensive Annual Market Report by the Austin Board of REALTORS®, we witnessed notable changes in both pricing and sales volume that reflect a broader trend in the housing market. Interestingly, the majority of these stats fail to show the full picture. In 2023, many sales involved seller concessions that effectively lowered the sales price, yet these metrics are not accounted for in median sales price figures. Key Market Changes in the Austin-Round Rock MSAA critical figure to highlight is the 10.2% decrease in the median home price, which settled at $450,000 in 2023. This adjustment in pricing is significant, considering the rapid price increases in previous years. Alongside this, the sales volume experienced a modest decline of 3%, culminating in a total of 30,353 sales across the MSA. These figures indicate a cooling market, aligning with broader economic trends and changes in buyer behavior. Inside the City Limits: A Closer Look at Austin ProperFocusing on Austin proper, the trends showed a more pronounced shift. The total sales for 2023 saw a near 15% decline, amounting to 8,554 total sales. This reduction in sales volume was more significant than in the wider MSA, suggesting a unique set of factors at play within the city limits. Moreover, the median sales price in Austin proper also witnessed an 8.2% decrease, bringing it to $540,000 for residential homes. This decrease is noteworthy, considering the city's previously consistent track record of rising property values. Understanding the 2023 Market DynamicsSeveral factors contributed to these market changes in 2023. Rising interest rates, economic uncertainties, and a shift in buyer priorities played a role in this cooling phase. Additionally, the market seems to be correcting itself after the unprecedented growth spurred by the pandemic years. These adjustments are essential for the long-term health and sustainability of the real estate market in Austin. What Does This Mean for Buyers and Sellers?For potential buyers, the current market presents the most favorable conditions we have seen in recent years. The softened prices and decreased competition offer a window of opportunity, especially for first-time buyers who were previously priced out of the market. However, it’s unclear how long this window will last. Anecdotally, it feels like the market is heating up and mortgage application rates have been increasing over the past few months- an indicator of buyer confidence returning. Sellers, on the other hand, face a more challenging environment. If you bought your home in the past two years, it’s unlikely that you will be able to sell for a profit today. If you purchased prior to 2019, conditions are much more favorable. If you are considering selling, you may want to consider alternative options. However, if you do determine you need to sell, the need for strategic pricing and effective marketing is more critical than ever to attract discerning buyers in a market that has shifted from its previous seller-friendly dynamics. Looking Ahead: The Future of Austin's Real Estate MarketAs we move forward, the Austin real estate market is expected to stabilize, reflecting more traditional market dynamics. Population growth has always driven Austin’s real estate market, and Austin remains an attractive place to live due to its vibrant culture, thriving economy, and quality of life. Within the city limits, Austin’s recent passing of the first phase of the Home Initiative should bring great opportunities for investors to capitalize on developing multi-unit properties and buyers to benefit from lower entry-cost housing. As always, Austin continues to be a dynamic and desirable location, and its real estate market remains a key indicator of its overall economic health and resilience. We foresee 2023 to be a blip on the charts in the long term - with Austin home prices continuing to appreciate in order to keep up with buyer demand.
0 Comments
 The Austin real estate market looks a lot different than it did just a few months ago. Where buyer’s once had to offer over asking price, free seller leasebacks, and stipulations to name their first born child after the seller just to purchase a home we are now seeing something very drastic. Sellers are, more times than not, getting one offer rather than twenty-six, offering monetary concessions to the buyer, and even accepting offers lower than their asking price. This does not imply the greater Austin real estate market is imploding; rather, the market is simply shifting.
This shift is predominantly due to two main factors - rising interest rates and increased supply. Earlier this year, mortgage rates were around 3.5%. Now, they are around 6%, and I wouldn’t expect them to go down in the near future. Let’s break that down a little. Imagine you are buying a $600,000 house with 20% down. Price: $600,000 Interest Rate: 3.5% Monthly Payment (before taxes and insurance): $2,155.41 Price: $600,000 Interest Rate: 6% Monthly Payment (before taxes and insurance):$2,877.84 That 2.5% rise in interest rates, resulted in an increase of $722.43 to a buyer’s monthly payment. As you can see from this example, rising interest rates made home ownership become less affordable on an on-going basis, and less attainable since fewer people could qualify for loans based on a lower debt to income ratio (DTI). Consequently the Austin real estate market, and frankly the entire U.S. market lost buyers. Simple economic theories tell us that if demand decreases, prices should too. However, many sellers were stuck in the mindset of earlier this year, expecting their home to sell fast and for top dollar. Unfortunately, it didn’t and they haven’t adjusted the price or made serious changes so it’s still sitting on the market. Now, Jack and Diane down the street have listed their house, and there’s a for sale sign in Jimmy’s yard too. This is happening at scale throughout the Austin metro. We are seeing way more available inventory in the market than we have seen in years. Last month, we had 9,045 active homes for sale in the Austin-Round Rock MSA. In March of 2022, that figure was 1,731. I honestly had to go back and check my work after pulling these stats because it’s that much of a shocker! Inventory has been steadily rising right in line with ever growing interest rates. However, in the grand scheme of things the Austin home inventory isn’t that high. When a market has six months of supply that is generally referred to as a balanced market in real estate. Anything above six months is a buyer’s market and below is a seller’s market. In the Austin-Round Rock MSA we currently have 2.9 months of inventory. While we may not technically be in a buyer’s market, it’s sure feeling like one. I’ve been negotiating crazy terms for my buyer clients, and I no longer have to rush to show a home the minute it hits the market out of fear it will be gone tomorrow. If you can stomach the short term pain of these interest rates or you can afford to pay cash for a home, it’s not a bad time to purchase real estate in Austin. Prices are dropping, and it’s a ripe time to get a good deal. 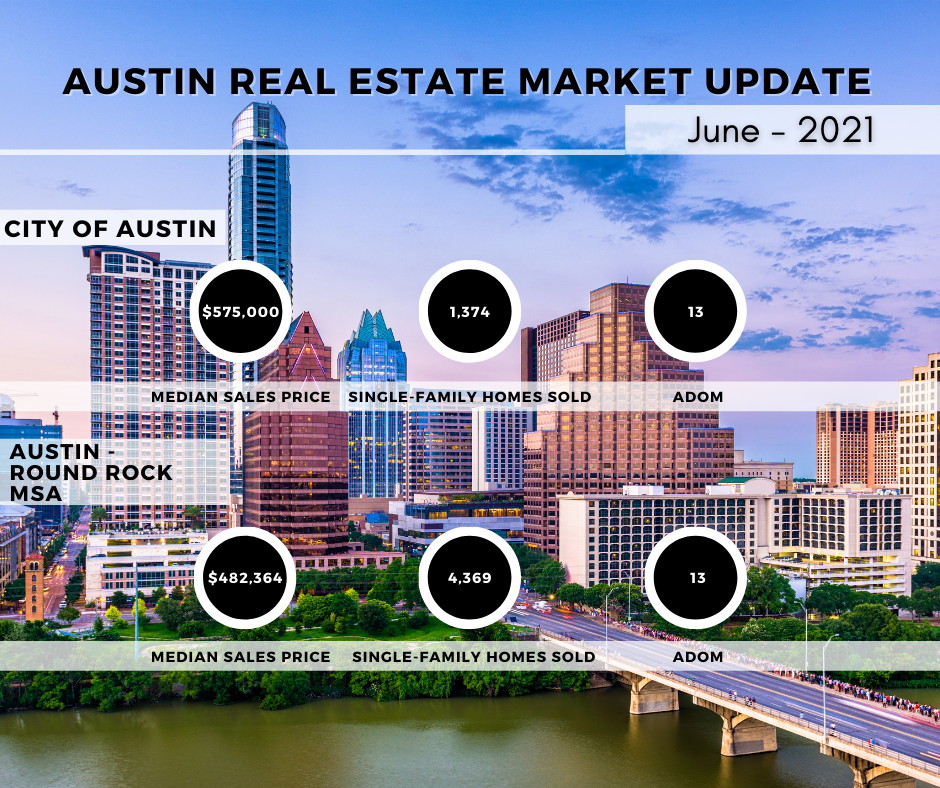 For months on end, it's seemed as if there was no end in sight for the incredibly competitive Austin real estate market. In fact, just looking at the latest numbers it still appears that way. Last month, the greater Austin area saw an all-time high median sales price of $482,364; Simultaneously 4,369 homes were sold, a record number of home sales compared to any previous June numbers.
Yet, these numbers don't show the full picture. Real estate stats are always lagging indicators. In general, it usually takes at least 30 days for a home to go from hitting the market to sold. Thus, the sales data for June is based on homes that hit the market in May. In the past month, we have started to see an increase in listings. It's not crazy, but it is impactful. In the City of Austin, we saw 2,044 new residential listings in June compared to 1,724 in May. An increase in supply is good news for prospective home buyers. This means more homes to choose from, and less competition. This subtle increase is exciting; yet we are still very far from a balanced market. You can still expect to see multiple offers. However, you may only be competing with a handful of other buyers compared to the double digit number of offers we frequently saw on homes over the past 6 months. As you might expect, the premium paid over ask price is simultaneously beginning to decrease. All of these indicators show that pricing is starting to stabilize but that doesn't mean home prices are going down. Home prices are likely to continue to stay at these elevated levels. That being said, I do foresee a return to the normal cyclical pattern for real estate sales in the Austin metro area. Over the past year, there was no normal slow down for the winter. In fact, the median sales price in the MSA stayed the same or increased month after month. In the future, I see a return of spring being the peak selling season- when buyers can expect the most inventory and sellers can expect to sell for the highest price. That being said, here are the latest Austin area market stats: City of Austin: Compared to June of 2020
Greater Austin Area (AKA Austin Round Rock MSA): Compared to June of 2020
Curious to know what's happening in your specific neighborhood? Contact me with any questions you may have. I’d love to hear from you! If you’ve been keeping an eye on the Austin real estate market lately, you’ve surely heard that the ATX has become one of, if not the most, competitive markets for home buyers in 2021. You’ve probably heard about homes flying off the market at record speeds, selling for hundred of thousands of dollars over asking price, and new builders only being able to sign 1 or 2 contracts a month for homes that won’t even be completed until 2022. However, something you may not have heard about yet is the subtle shift in the Austin real estate market over the past two weeks. I’ve seen homes sell for asking price, homes that only had a few offers, and the return of due diligence periods. This shift is subtle, and if you are not actively working in it everyday, you may not even notice it. But I feel it, and if it continues, it will have implications. You may be wondering why this may be. All of the signs point towards continued demand and thus higher prices. And, that is still true, but the market is behaving slightly differently. I hypothesize this subtle shift is due to a few different variables.  Disheartened BuyersMany individuals looking to purchase in the Austin market are quite simply beginning to feel defeated. I have a few buyers who have been trying to buy a home for the past few months, and are still empty handed. They’ve offered well over asking price, waived their appraisal contingencies, and offered 5 digit earnest money deposits yet they still haven’t been able to get an accepted contract. After the 4th or 5th time of this, some buyers begin to feel like they simply cannot win in this ultra-competitive market. Some of these buyers decide to stop trying altogether, or opt to purchase in another city altogether. Others are still observing from afar, but are less motivated to make offers on available homes. Sold Home Data is Starting to Show the Truth of the MarketIn order to determine an appropriate asking price for a home, you need to look at the sold prices for comparable homes. Since the home sale cycle from list date to close date is usually around 30 days, sold stats are constantly lagging behind the market. Over the past few months, most homes have been appropriately listed at prices determined by the sold comparable homes. However, the majority of those homes went under-contract at a price far higher than the asking price. We are now beginning to see those homes close, and new listings are being priced using those sold stats. For single-family homes listed in the Austin MLS, the median list price/sqft increased from $197/sqft in February to $213/sqft in March. As listing prices are increasing, I foresee this leveling out the difference between asking price and contract price. This is not to say that the majority of homes will not continue to sell for above asking price. I think that trend will continue, but I think we will see the difference between asking price and sold price decrease. Earlier this year we saw some homes selling for hundred of thousands of dollars over asking price; I foresee the ratio of list price to close price decreasing in the coming months. Increase in InventoryThe February storms caused a serious strain on an already tight supply of inventory in the Austin market. Some homeowners that planned to list in February were forced to wait to list due to unexpected repairs as a result of storm damage. Others simply decided to wait to list, since the city was essentially shut own for an entire week. In February, we had 2,360 new single-family residential home listings in the Austin MLS. In March, we had 3,745 new single-family homes hit the market. Historically, we see the largest inventory increases in the Austin real estate market between March through July. So far, the number of new listings in 2021 has been lower than what we saw last year (even with the pandemic). However, it looks like the trend for increased listings in the spring to summer months will continue for 2021.  What This Subtle Shift Means for Austin Buyers and SellersThis subtle shift should benefit those looking to purchase in the Austin market. Home prices likely will continue to be the highest they have ever been, BUT as sold comps catch up to the true market it will be easier for buyers to purchase homes. Appraisal waivers (essentially agreeing to purchase the home no matter what it appraises for and agreeing to bring the difference between the appraised value and the offer price in cash to closing) were almost mandatory over the past few months. This made it nearly impossible for someone without a ton of extra liquidity to compete in multiple offer situations. It was particularly detrimental to those buyers looking to purchase a home using a VA or FHA loan as these loan programs expressly prohibit the use of the Appraisal Waiver Addendum. Now that we are beginning to see the new market sales data, homes are more likely to appraise at or closer to offer prices. This has huge implications for any buyer using a loan to purchase a home.
For someone considering selling their home in Austin in the near future, you can still expect your home to sell for top dollar. In fact, you will likely get more for your home in the coming months than if you had listed your home for sale in the first quarter of 2021. However, you may not get all of the other offer terms that many home sellers received earlier this year. We saw home sellers receiving offers where the buyer incentivized the seller with a complimentary lease back. Sometimes, the buyer offered for the seller to stay in their home for an entire year for free after the buyers purchased the home. These will likely become more conservative or dissipate entirely. You also may see the re-emergence of typical seller expenses such as the title policy, and buyers may begin requesting a seller paid for home warranty again. All in all, these nominal expenses will not adversely affect your bottom line. You can expect to still sell your home for the highest price, but you may arrive there with fewer offers and more buyer preference in regards to offer terms. If you have questions about the Austin real estate market, or need advice when contemplating your next move, contact me. 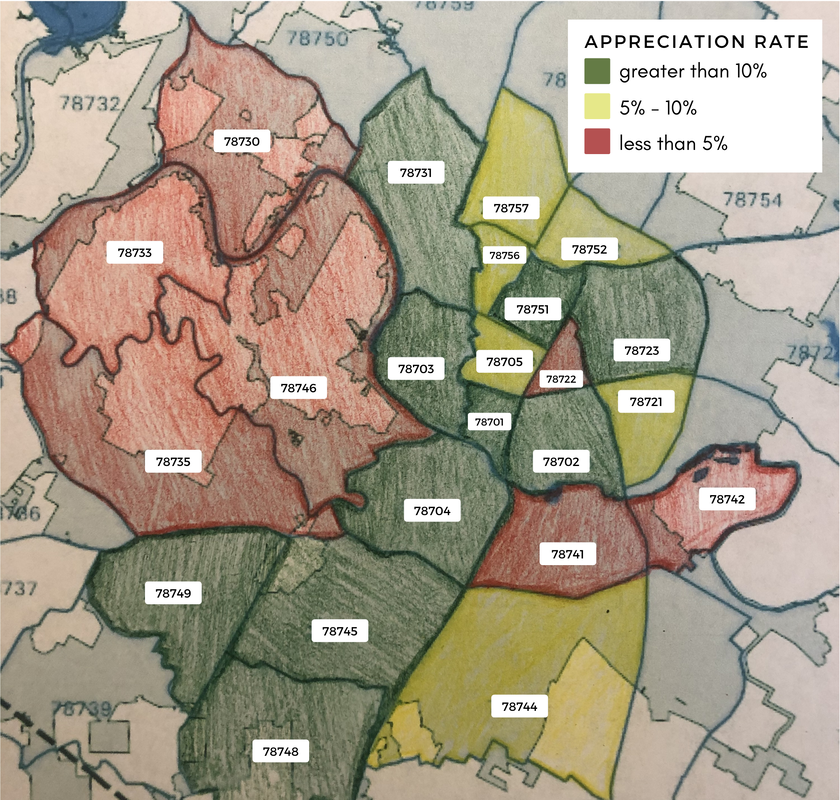 In the course of my day to day to activities, I oftentimes get asked about the appreciation rate in the Austin market, and my thoughts on the future of the Austin housing market. When responding to these inquiries, it’s important that I explain the different methodologies in calculating the appreciation rate. When you analyze the appreciation rate of anything you are simply comparing the current value to a previous value and reporting the percentage in change. However, the observations derived from these figures can vary drastically by what metrics you are using. If you look at the appreciation rate based on the average sales price, your results will be skewed by high and low outliers. For this reason, I prefer to use the median sales price when assessing the appreciation rate for Austin area homes. However, simply utilizing the median sales price has its own flaws. What if the homes sold in 2020 were all much larger than the homes sold in 2019? Your results would be skewed. Thus, when looking at the appreciation rate, I prefer to compare the median price per square foot. Even using this metric, results can still be unreliable. If there were far fewer sales in one year than the other, the appreciation rate derived may not reflect the true nature of the market. That being said, everyone wants to know what the appreciation rate is for homes in the greater Austin area. I myself was curious after looking over the year over year growth for Austin homes from July 2019 to July 2020. I knew that by only comparing these two months of data, the statistics were not illustrating the true picture for certain neighborhoods. Thus, I got to work and combed through the data to try to form a more clear picture. Before I illustrate my findings, I would like to point out a few factors in regards to the data utilized. All of the information I pulled was from the Austin Board of Realtors MLS. I limited my search to the most central Austin area zip codes, and I analyzed sales data for all single family homes. This included new and existing condo, townhome, and traditional home sales. I compared the sales thus far in 2020 with all sales in 2019. Inherently, there are some flaws to this approach as there is a complete year of data for 2019 and only partial data for 2020. That being said, here is what I found. 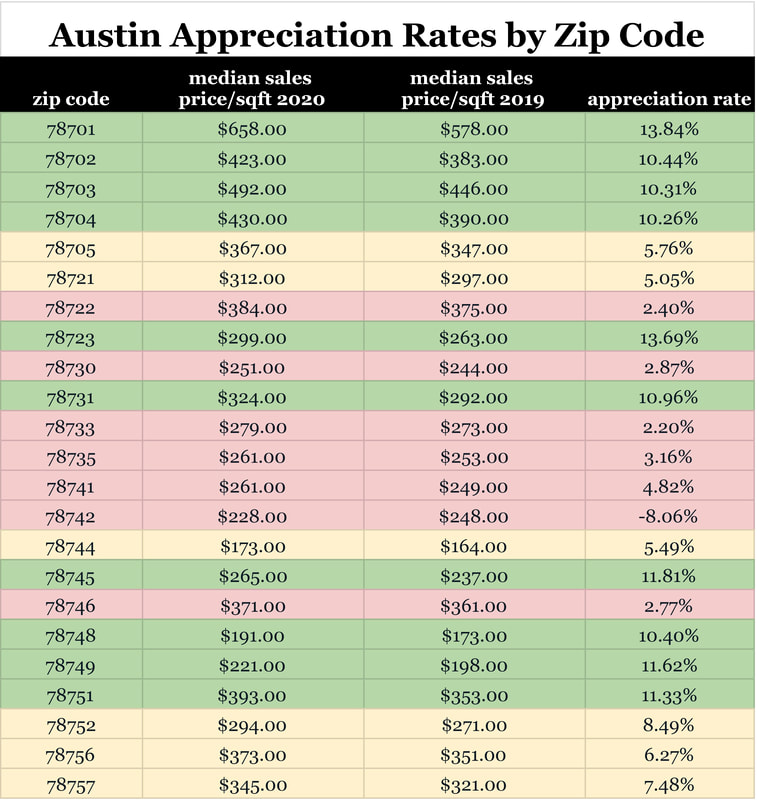 If you look at the median sales price per square foot, the 78701 zip code had the highest appreciation rate among central Austin zip codes. 78701 had an appreciation rate of 13.84% with the median sales price per square foot in 2020 at $658. This data was pulled from approximately 160 sales in 2020 compared to around 300 sales in 2019. It will be interesting to review these stats once a full year of data for 2020 is available. However, this downtown zip code has a strong track record of appreciation with an increase of about 10% for the median sales price per square foot between 2018 to 2019. The 78742 zip code showed the lowest level of appreciation in the Austin area. In fact, it was the only zip code I analyzed that actually depreciated between 2019 to 2020. In 2020, the median sales price per square foot was $228 compared to $248 in 2019. However, there were only two sales in 2020 and five in 2019, and thus this data set is too small to draw meaningful conclusions. Although, I think the results are less significant, I also analyzed the appreciation rate among the same Austin area zip codes based on the median sales price. Based on this methodology, the zip code in Austin with the highest appreciation rate between 2019 to 2020 is 78746. Homes in 78746 appreciated 19.76% between 2019 to 2020. This data was pulled from 426 sales in 2019 and 232 sales in 2020. The 78742 zip code similarly showed the lowest level of depreciation when analyzing the change based on the median sales price; however, as previously mentioned, the limited number of total sales in this zip code obscures the validity of this figure. 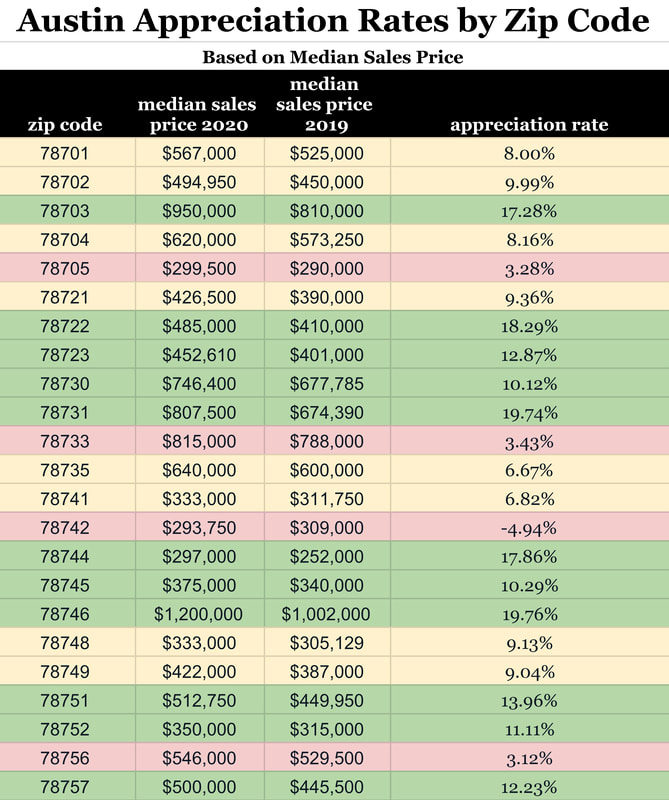 All in all, it is important to assess appreciation rates in the Austin real estate market. When you own a home and its value appreciates over time, you make money when you sell! And, when you leverage your home purchase with a mortgage, that appreciation benefit is compounded based on the fact that you’re profiting off the appreciation value of the entire home, when only paying a portion of the home’s value in your down payment. For example, if you bought a home for $300,000 and put 20% down ($60,000) and that home appreciated 10% you would make a $30,000 gain on a $60,000 investment. It’s a bit more complicated when you throw mortgage payments into the mix, but you can easily see why understanding a given area’s appreciation rate is important. That being said, make sure to take a comprehensive look at the data and recognize its potential limitations when evaluating a market based on the appreciation rate.
If you have questions about the appreciation rate in your Austin neighborhood, contact me today. I’d be happy to do the research and provide you with the data you need to make an informed decision.  After a lull in real estate sales during the typically peak spring selling season, the Austin real estate market is showing a rebound in full force this summer.
In the City of Austin, the median sales price rose to $423,000; this figure is up 11% compared to last July. The total number of home sales within the city limits also increased 21% from July 2019. There were 1,470 closed residential home sales in the City of Austin last month. Inventory remains critically low, and we are seeing homes spend less time on the market too. Within the city limits, homes spent an average of 29 days on the market in July. Within the greater Austin area, we saw similar trends. The median sales price for single family homes in the Austin-Round Rock MSA increased 10% from July of 2019, and the number of total homes sales for July increased at the same year over year rate as within the city limits, 21%. Homes in the greater Austin area spent a little more time on the market last month compared to homes within the city limits. The average days on market within the Austin-Round Rock MSA was 44 days last month - still 3 days less than July of 2019. Unprecedentedly low interest rates are fueling buyer demand, and despite Covid-19 concerns the Austin economy is still managing to create new jobs that spur an influx of new residents. Combined these factors resulted in the second strong month of consecutive home sales within the greater Austin area. Now, the real question is do we have enough housing supply to keep up with buyer demand? Want to know what’s happening in your hyper-local Austin market? Contact me today and I’ll give you the run down! In a previous post, I discussed how the effects of the coronavirus on the Austin housing market are still uncertain. Since, writing that post, many things have changed. A shelter in place order has been put into effect for the City of Austin, Travis County, Williamson County, and Hays County. Each of these ordinances varies slightly, and while real estate services are included as an essential professional service, the extent to which a REALTOR can perform his or her job duties is limited by these orders. The City of Austin ordinance as well as the Travis County order explicitly prohibit the showing of homes during the coronavirus shelter in place.  While other counties do not necessarily prohibit showing homes, the spirit of all orders is to allow real estate services that are truly essential. Assisting in the successful completion of closings for homes that are already under contract, providing critical property management services, and housing unhoused individuals is permitted while maintaining social distancing protocols. That being said, these orders severely limit the amount of real estate activity that can legally take place. On March 20th, I took note of the recent market activity for residential homes in the greater Austin area. All stats that follow are based on statistics for all single family homes in the Austin MLS. This includes homes, condos, and townhomes. From 3/19/2020 to 3/20/2020, there were 287 new home listings. One week later, the number of new listings dropped by 114. The number of pending home sales similarly decreased but not nearly as dramatically. On Friday, March 20th, there were 136 pending home sales. In comparison, we saw 18 pending home sales on Friday the 27th of March. Additionally, home sales decreased from 145 on the 20th to 108 on the 27th. The number of homes leaving the MLS is also indicative of the effect of Covid-19 on the Austin real estate market. Between March 19th and March 20th, 16 homes were withdrawn from the Austin MLS. That number rose to 23 between 3/26/2020 and 3/27/2020. Real estate agents also have the availability to change the MLS status of homes to temporarily off market. On Friday the 20th, 35 homes were changed to this temporary status. Yesterday, March 27th, there were 47 homes that went to temporarily off market status. These numbers are more substantial when looked at from a greater duration of time. In the 3 days prior to 3/20/20, 91 homes went to temporarily off market status. In comparison, 196 homes were temporarily taken off the market between March 25th and March 27th.
In short, Covid-19 and the resulting shelter in place orders are affecting the Austin real estate market. If you can’t physically show homes, there will be far fewer home sales. In my personal business, I am seeing these effects first hand. Clients who planned to list their homes and buy new ones are holding off until after the coronavirus pandemic. My new construction deals are continuing; however, the implications of the shelter in place orders will very likely slow construction on many homes. As always, if you have specific questions feel free to contact me.  As is the case with almost every aspect of our lives, there is a lot of uncertainty around how the coronavirus will affect the local housing market. Over the past few years, the Austin housing market has been increasingly competitive with the average home sales price rising year over year. Will Covid-19 slow sales or will buyers jump to take advantage of historically low interest rates? The Impact of Covid-19 on Austin Home BuyersThe coronavirus has began to change our daily lives. Many are practicing social distancing, self-quarantining, and generally spending less time outside of the home. Going into someone else’s home is just one more opportunity to come in contact with germs, and surely there are quite a few buyers foregoing showings at the present moment. According to a survey performed by the National Association of REALTORs last week, only 16% of real estate agents said the coronavirus has affected buyer interest. However, I would have said the same thing last Monday when surveyed. It wasn’t until last Tuesday, that I heard from my first buyer client that they would be holding off on their home search until the Covid-19 scare blows over. Will the Coronavirus Reduce the Number of Homes on the Market?Sellers may also have fears about letting strangers into their homes. In Austin, we have had incredibly low inventory for far too long. There are simply not enough homes for sale to accommodate the ever growing buyer interest. Will sellers decide not to list their home due to fears of contamination? It’s quite probable, and this will only exacerbate the low inventory issue. Builders too are seeing the affects of the coronavirus. Nearly 1/3 of our raw building materials come from China, and this doesn’t even account for assembled goods such as appliances and fixtures. First hand, I’ve already witnessed supply chain issues, with new home buyer clients unable to get tile they had originally ordered since it was produced in China. If builders are delayed due to material delays, and sellers are reluctant to list, it won’t matter that interest rates are at historically low levels. Buyers won’t have any homes to buy. How Will the Corona Virus Impact the Seasonality of the Austin Real Estate MarketWe are just entering what is typically the spring selling season in the Austin area. Usually, this is when the largest percentage of sellers list their home, and the majority of buyers purchase. Home sale prices are usually the highest in the coming months as buyers compete with one another to move while school is out of session. However, it’s unknown how the coronavirus will affect the seasonality of the Austin market. Will it delay the spring selling season? Will it have no affect at all? Or, will it cause a mass recession leaving buyers unmotivated to make moves. After all, what good is an incredibly low interest rate if you are not sure you will have a job next month. What Can We Learn From the Past?In the past, Austin has been largely spared from housing market collapses. In 2009, the median sales price dropped from $192,000 in 2008 to $190,000. It increased to $195,000 in 2010 and stayed the same for 2011. Since then, the median sales price has been steadily increasing. We wrapped up 2019 with a median sales prices of $315,000 for the greater Austin area. While the median sales price changes from 2008-2011 were not too significant, the number of sales dropped significantly beginning in 2007. Between 2007 to 2008, the number of home sales in the greater Austin area dropped by about five thousand, and the number of home sales continued to slowly decline each year until 2011. In 2009, the Austin real estate market saw its lowest number of annual sales with only 18,632 sales occurring. In comparison, 35,437 homes sold in the greater Austin area last year.
It’s not unrealistic to think that the coronavirus may slow Austin area home sales yet again. Furthermore, if there is one area that may be more affected than others, I suspect it will be the luxury home market. After the housing market crash, we saw these types of homes suffer the most. Overall, it’s still too early to say how the coronavirus will affect the Austin market. If you have questions about how it may affect your specific real estate goals, give me a call. I’m happy to share my opinions with you. 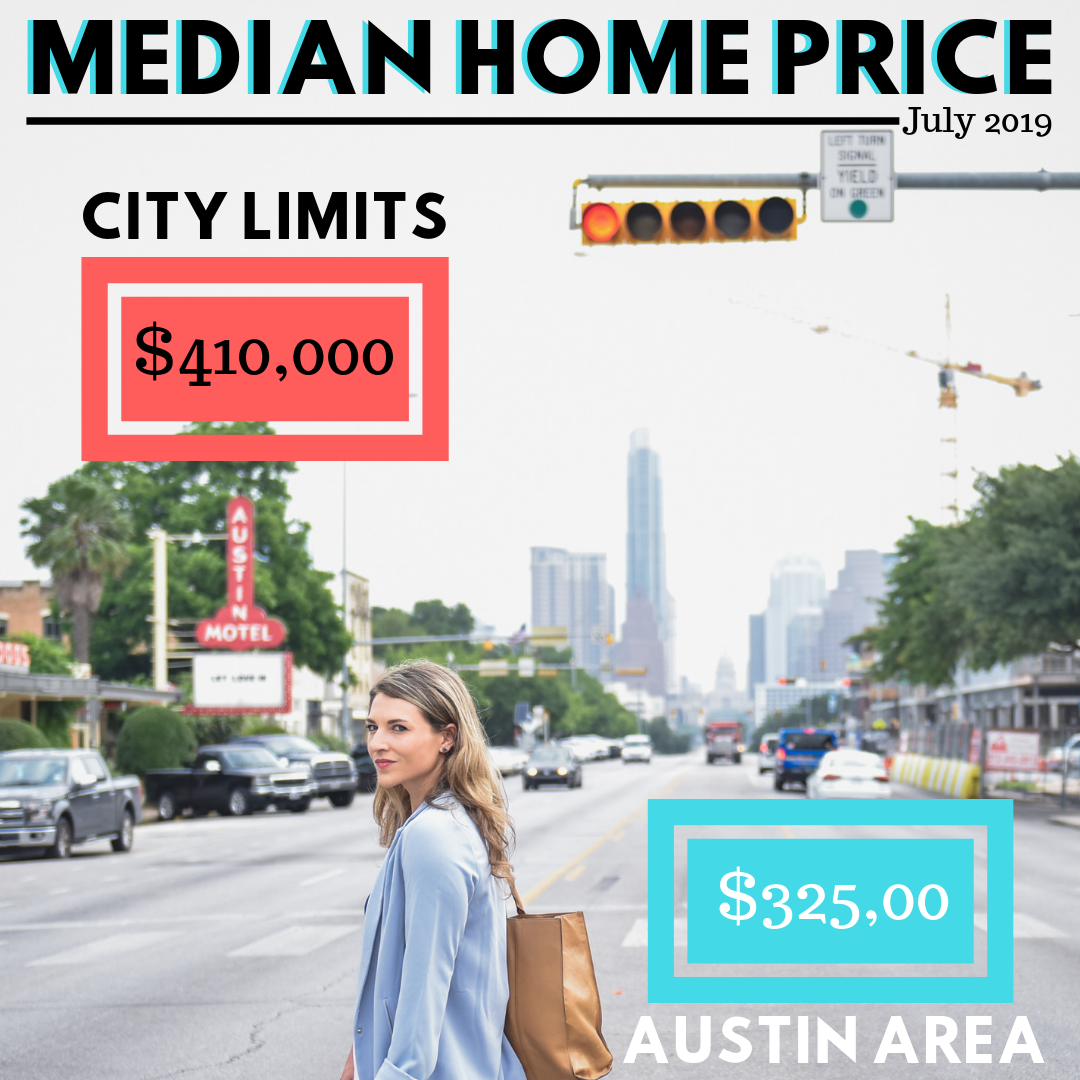 The temperature is not the only thing heating up in Austin this time of year; the central Texas real estate market is HOT, HOT, HOT! Last week, the Austin Board of REALTORS released the July 2019 home sales report; it revealed that the median sales price increased year over year for single family homes located within the city limits and those in the greater Austin area. Additionally, Austin area home sales set an all time high for any July on record with total sales topping out at 3,439 for the entire greater Austin area.
Within the greater Austin area, the median sales price for single family homes increased 3% from last year to $325,000. Simultaneously, the sales dollar volume increased 15.4% to $1,407,009,110. Within the city limits, a shortage of supply is keeping the total number of homes sold lower. Last month, 943 homes sold in the city limits down just slightly from 952 homes sold in July of 2018. Additionally, those homes that are on the market are staying there for less time. The average days on market for homes in the city limits dropped to 29 days last month. Within the city limits, the median sales price increased 3% year over year to $410,000. However, this figure is still lower than the median sales price for homes that sold within the city limits last month. In June, the median sales price of single family homes within the city of Austin was $420,000. This is not surprising, as historically you tend to see highest sales prices in the Austin area throughout the spring and early summer months. All in all these stats show that the Austin market is still going strong. As long as there are homes to buy, people will keep buying them, and they are willing to pay a premium in order to do so! Recently, I was showing a client of mine some condos in central Austin. She was trying to decide between a condo in Clarksville and a condo in 78704, and she asked which area appreciated better. From the seat of my pants, I speculated that 78704 condos have appreciated more than Clarksville condos. This hypothesis was based on the fact that Clarksville condos have been pricier for some time, so it seemed logical that the 78704 condos would have appreciated more in the past ten years or so.  When I got home, I ran some numbers. I looked at the median sales price annually from 2009-2019 for condos in the following central Austin zip codes: 78701, 78702, 78703, 78704, 78705, and 78751. I then calculated the appreciation rate for condos in each zip code between 2009-2018. The median sales price for 2019 would not have provided accurate data since we are only a few months in to 2019. As I suspected, condos in 78704 appreciated more than condos in Clarksville (78703). In fact, condos in 78704 had the highest appreciation rate out of all of the central Austin zip codes. In 2008, the median sales price for condos in Austin’s 78704 zip code was just over $169k. In 2018, that number shot up to $376K. In 78704, we are seeing a lot of condo regimes. A condo regime happens when a developer takes a traditional single family lot and constructs two new units on the lot. Often times these units are not attached and live like single family homes. However, they are technically condos and sell for much more than a traditional condo. Thus, I am not surprised by this appreciation rate. 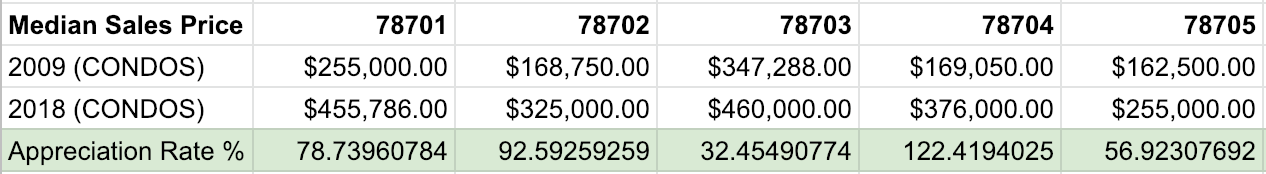 In 78703, which consists of Tarrytown, Clarksville, and Old West Austin the median sales price for condos in 2009 was a little over $347K, compared to $460K in 2018. Out of all the central Austin zip codes I looked at, 78703 had the lowest condo appreciation rate at just over 32%. As would be expected, condos in East Austin appreciated well over the last 9 years. In 78702, the median sales price for condos in 2009 was about $168K. Last year, that figure jumped to 325K. Condos in downtown Austin appreciated about 78% between 2009-2018. In comparison, condos in 78705, which encompasses the UT campus area, appreciated about 57%.  Overall, condos in central Austin have appreciated well. If you talk to anyone who purchased a condo about 10 years ago, they will usually tell you one of two things, “I wish I bought more” or “I wish I hadn’t sold 5 years ago, even though I thought I was making a killing when I sold.” If you are considering buying a condo in central Austin or are curious how much your condo is worth, contact me today. Central Austin Condo Appreciation Video |